Proving Event Marketing ROI in 2026: Metrics & Strategies to Justify Your Budget
Intro: In 2026’s results-driven landscape, event marketers can no longer rely on gut feeling or vanity metrics – every marketing dollar is under the microscope. Stakeholders want hard evidence that your campaigns are driving ticket sales, revenue, and long-term attendee growth. This comprehensive guide shows how to measure and prove return on investment (ROI) for event marketing campaigns in 2026. We’ll break down essential metrics like CAC (Customer Acquisition Cost), ROAS (Return on Ad Spend), and CLV (Customer Lifetime Value), and explore practical ways to track them – from multi-touch attribution models to post-event surveys. Through real examples and case studies, you’ll learn to tie your marketing spend to tangible outcomes, justify budgets to stakeholders, and make confident data-driven decisions for future events.
The ROI Imperative in 2026
Why Every Marketing Dollar Must Show Results
In 2026, proving ROI isn’t just a nice-to-have – it’s a mandate. Marketing budgets are rebounding post-pandemic but also facing greater scrutiny. According to industry surveys, over 70% of event professionals struggle to demonstrate the ROI of in-person events to their stakeholders. CFOs and event directors are insisting on clear evidence of impact before signing off on spend. Gone are the days of “spray and pray” advertising; now every ad, email, and influencer post needs to pull its weight. Experienced event marketers emphasise an ROI-first mindset, calculating exactly what each campaign returns in ticket revenue by embracing ROI-focused strategies. If you spend £1 on marketing, you’d better show at least £2–£5 coming back in ticket sales or future value. This hard-nosed approach helps ensure no budget is wasted on vanity projects that don’t ultimately sell tickets.
Rising Costs, Competition, and Stakeholder Expectations
Driving ROI has become more critical as advertising costs rise and competition for attendees’ attention intensifies. Meta and Google ad prices have increased, and new privacy rules have made targeting less precise, meaning every pound spent needs to work smarter. Simultaneously, event-goers have more choices than ever, so marketing must be efficient and laser-focused. Stakeholders – whether festival owners, corporate clients, or venue managers – are also more numbers-driven. They expect marketing teams to justify budgets with data. For example, instead of just saying “our TikTok campaign went well,” you might need to report that “our TikTok ads generated 500 ticket sales at a cost of £8 each, yielding a 5x ROAS.” Tangible results like these make it far easier to defend (or even increase) your budget. On the flip side, failing to tie spend to outcomes can result in cuts or losing trust. The message in 2026 is clear: prove it or lose it.
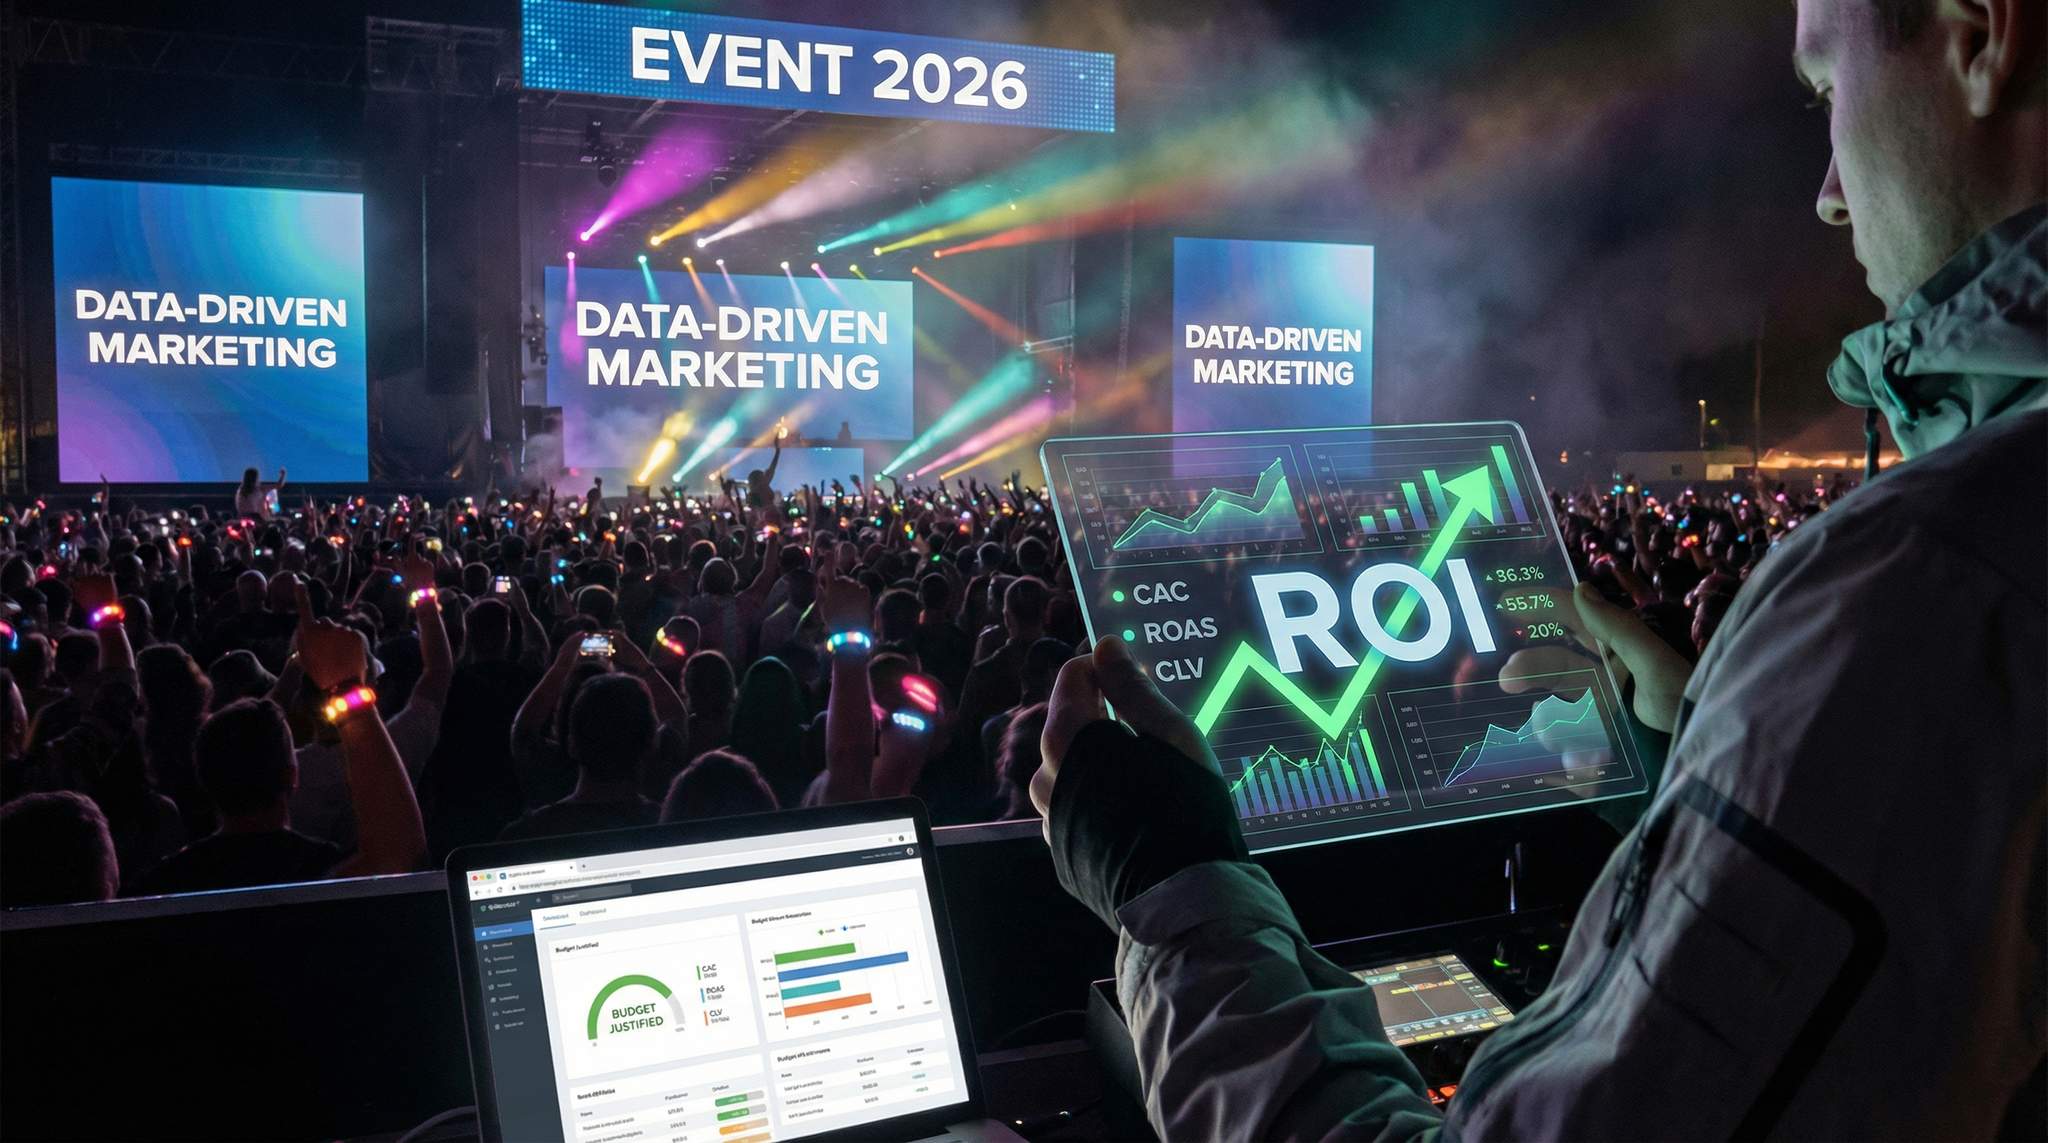
Adopting a Data-Driven Mindset
Leading event promoters have responded to this pressure by embracing data at every turn. They set clear goals, track performance rigorously, and pivot quickly based on what the numbers show. If a campaign isn’t delivering a return, they either optimize it or reallocate the budget to a channel that is. This data-driven culture is particularly vital for those working with tight funds – a small event with a £5,000 marketing budget can’t afford not to measure what works. Setting up analytics and dashboards (which we’ll cover later) is now as fundamental as booking the venue or talent. By treating marketing data as a decision-making tool, successful event marketers can continuously refine their tactics. The payoff is huge: organizers who adopt real-time metrics and agile adjustments have seen 10–20% increases in ticket revenue by shifting spend to the highest-ROI channels mid-campaign. Overall, a data-driven approach turns marketing from a cost center into a predictable revenue generator – exactly what stakeholders want to see.
Data-Driven Event Marketing
Track ticket sales, demographics, marketing ROI, and social reach in real time. Exportable reports give you the insights to make smarter decisions.
Core Metrics for Event Marketing ROI
When evaluating the health of your promotional campaigns, understanding the core event finance metrics in 2026 is non-negotiable. While vanity metrics like social media impressions might look good on a dashboard, stakeholders and investors are strictly focused on the financial indicators that dictate profitability. By mastering these essential financial metrics for events, organizers can bridge the gap between marketing activities and bottom-line revenue.
Customer Acquisition Cost (CAC)
Customer Acquisition Cost (CAC) tells you how much you spend to acquire each ticket buyer. It’s a critical metric for understanding marketing efficiency. To calculate CAC, divide your total marketing spend by the number of new customers (ticket purchasers) acquired in a given period or campaign. For example, if you spent £10,000 on advertising and sold 500 tickets to unique buyers, your average CAC is £20. In event marketing, we often look at CAC per channel as well – e.g. CAC from Facebook Ads vs. CAC from email marketing. This helps identify which channels bring in ticket buyers most cheaply. A low CAC means you’re getting more attendees for your money, which usually signals a strong ROI. Experienced promoters constantly monitor CAC and cut spend on high-CAC channels that aren’t justified by ticket prices or lifetime value. Keep in mind that CAC should be viewed in context with revenue: if your average ticket price (or attendee value) is lower than your CAC, you’re essentially paying more to get a customer than they spend – an unsustainable situation. Typically, you’ll want the revenue per attendee to be at least 2–3 times the CAC to account for other costs and profit margin.
Ready to Sell Tickets?
Create professional event pages with built-in payment processing, marketing tools, and real-time analytics.
Return on Ad Spend (ROAS) vs. ROI
Return on Ad Spend (ROAS) measures the revenue generated for each dollar (or pound) spent on advertising. It’s usually expressed as a multiple – for instance, a 5x ROAS means £5 in revenue for every £1 spent on ads. ROAS is a more focused metric specific to marketing spend, while Return on Investment (ROI) usually refers to overall profitability (net return divided by cost). In marketing campaigns, people often use “ROI” loosely, but it’s important to distinguish: ROAS looks at gross revenue vs. spend, whereas true ROI accounts for net profit. Both are useful. ROAS is simpler to calculate quickly for advertising channels, and a high ROAS indicates an efficient campaign. For example, if you put $5,000 into Facebook ads and attribute $20,000 in ticket sales to those ads, that’s a 4x ROAS. The ROI in profit terms would be (($20,000 – $5,000) / $5,000) * 100% = 300% ROI. In 2026, event marketers track ROAS for each digital platform (Facebook, Instagram, TikTok, Google, etc.) to see which gives the best bang for the buck. A ROAS below 1x (or ROI below 0%) means you’re losing money on that channel – spending more than the revenue it’s bringing in. For instance, one festival’s online ad campaign delivered an impressive 10.7x ROAS after they optimized with retargeting (approximately $44,576 revenue from a $4,190 spend). That kind of insight makes it easy to justify doubling down on similar campaigns. The goal is to identify which marketing activities make money (high ROAS/ROI) and scale them up, while cutting back on those that don’t.
Customer Lifetime Value (CLV)
Not all ROI is immediate – that’s where Customer Lifetime Value (CLV) comes in. CLV estimates the total revenue a single customer (attendee) will generate over their relationship with your event or brand. In event marketing, CLV might consider that an attendee could come to multiple events (e.g. an annual festival or a concert series) or spend money on upgrades, merchandise, and concessions. For example, if a fan attends your festival three years in a row and spends $150 in tickets and merch each time, their CLV could be $450 or more. Knowing CLV helps you make smarter marketing investments. You might be willing to spend $30 or $50 CAC to acquire a festival-goer if you know their lifetime value is several hundred dollars across future events. CLV also highlights the importance of attendee retention and loyalty. Research by Bain & Company famously showed that increasing customer retention by just 5% can boost profits by 25% to 95%. That’s because returning customers are cheaper to market to and tend to spend more over time. For events, a loyal attendee base that keeps coming back (and bringing friends) dramatically lowers your marketing costs in the long run. To leverage CLV, event marketers track repeat attendance rates, upsell data (like how many GA buyers upgrade to VIP in later years), and referral activity. If you find that 40% of last year’s attendees bought tickets again, you’ve got a strong retention rate – and you can justify investing in loyalty programs, VIP perks, or year-round engagement to further increase that lifetime value.
Key Event Marketing Metrics at a Glance: The table below summarizes core ROI metrics and how to calculate them:
Metric What It Measures How to Calculate Example Customer Acquisition Cost (CAC) Average cost to acquire one ticket buyer Total marketing spend / Number of new ticket buyers Spent £5,000 on ads for 250 new attendees ? CAC = £20 Return on Ad Spend (ROAS) Revenue generated per £1 of ad spend (efficiency of ads) Total revenue from ads / Advertising cost (expressed as a multiple) £20k revenue / £5k ad spend ? ROAS = 4× (4x revenue) Marketing ROI Overall return on marketing investment, accounting for profit (Revenue – Marketing cost) / Marketing cost × 100% (expressed as % gain) (£20k – £5k) / £5k = 300% ROI (3:1 return) Customer Lifetime Value (CLV) Total revenue expected from a customer over their lifetime Average revenue per attendee × Number of events attended (plus upsells) Fan spends £75 across 3 events ? CLV = £225
Table 1: Key ROI-related metrics for event marketing and simple examples of each.
Turn Fans Into Your Marketing Team
Ticket Fairy's built-in referral rewards system incentivizes attendees to share your event, delivering 15-25% sales boosts and 30x ROI vs paid ads.
Attribution and Tracking Strategies
Last-Touch vs. Multi-Touch Attribution
One of the biggest challenges in proving event marketing ROI is figuring out which marketing touchpoints deserve credit for a ticket sale. The simplest method is last-touch attribution, which credits the final touchpoint that led to a conversion (e.g. the visitor clicked a Google ad and bought a ticket, so Google gets 100% credit). Last-touch is easy to implement and is the default in many tracking tools, but it has a blind spot: it ignores the influence of earlier touches like an email open or a social media view that warmed up the buyer. In 2026, with event audiences encountering your brand on multiple channels, multi-touch attribution models paint a more accurate picture. These models distribute credit across all significant touchpoints in the customer journey. For example, a multi-touch model might assign 50% credit to that final Google ad click, but also 30% to an Instagram ad the week before, and 20% to an email newsletter that introduced the event. The result is a fuller understanding of how your marketing mix drives sales. Many event marketers start with a simple multi-touch approach – such as giving equal credit to every channel that touched the customer – and then refine from there. More advanced models (like time-decay, which gives more weight to touches closer to purchase, or algorithmic data-driven attribution) require more data but can further pinpoint ROI. The key is to avoid one channel taking all the credit when, in reality, your attendee likely took a journey through multiple messages. By adopting multi-touch attribution, event promoters ensure that they recognize the contributions of upper-funnel channels (like those awareness-building PR hits or influencer posts) in addition to the final conversion driver.
Digital Tracking Tools (UTMs, Pixels, Analytics)
Digital tracking tools are the backbone of measuring marketing ROI. It starts with setting up a robust analytics foundation. Every event marketer in 2026 should use web analytics (like Google Analytics 4) on their event site and ticketing pages to capture visitor data and conversion events. This means tagging all your links with UTM parameters or unique identifiers. For instance, if you run a Facebook Ad for an early-bird sale, the link might include utm_source=facebook&utm_campaign=EarlyBird. These UTM tags let your analytics tell you exactly how many visitors (and ticket buyers) came from that specific ad campaign. Do the same for every channel – one for your email blasts, one for Instagram Stories, one for that promo on a partner blog. With UTMs, when someone buys a ticket on your site, you can attribute that sale back to the precise source that delivered the user. In parallel, install tracking pixels (like the Meta Pixel, Google Ads conversion tag, TikTok Pixel, etc.) on your event pages. These pixels report conversions back to the ad platforms, allowing you to see, for example, that your Google Ad campaign drove 50 purchases at an average cost of $10 each. Pixels also enable retargeting – showing follow-up ads to people who visited the ticket page but didn’t buy, thus improving your eventual ROI by bringing back warm prospects. Be aware that recent privacy changes (like iOS opt-outs) mean these pixels sometimes under-report conversions; that’s why combining them with your own first-party analytics is crucial.
Grow Your Events
Leverage referral marketing, social sharing incentives, and audience insights to sell more tickets.
Navigating event marketing ROI measurement difficulties in 2026 often comes down to fragmented data. To combat this, mastering event tracking in Google Analytics 4 (GA4) is essential to improve marketing ROI. GA4 allows organizers to build custom conversion events—such as tracking when a user views a VIP package versus a general admission ticket—giving you granular visibility into which digital marketing efforts drive the highest-value actions. By linking GA4 directly with your ticketing platform, you can bypass many of the measurement hurdles caused by cookie deprecation and iOS privacy updates.
On the analytics dashboard, set up conversion goals for key actions (ticket purchase, add-to-cart, etc.). This lets you easily monitor conversion rates by source. For example, you might see that 500 people came from your “SummerFest Lineup Announcement” email and 50 purchased tickets – a strong 10% conversion rate, indicating that email was effective. Meanwhile, 1,000 came from a Twitter post but only 10 bought – a 1% rate, perhaps due to lower intent from that channel. These insights help you continuously optimize where to invest. Tip: Track micro-conversions too, like newsletter signups or RSVPs, which are early indicators of interest that you can nurture into sales. Modern analytics tools and CRM-integrated platforms make it possible to follow the entire user journey. In short, instrument everything – if it moves, track it. When your data is set up properly, you’ll have the evidence to confidently say “Channel X delivered Y tickets at Z cost each,” which is gold for proving ROI.
Offline and Cross-Channel Attribution Methods
Not all event marketing happens online – so how do you track ROI for offline or non-digital efforts like print flyers, radio spots, or on-ground street teams? The answer is to make those channels as trackable as possible. Savvy event marketers use unique promo codes and customized links for any offline campaign. For example, give your flyer a simple QR code or URL like YourEvent.com/vipflyer that leads to the ticket page with a special tracking code applied. If 200 people scan that and buy tickets, you know the flyers worked (and exactly how many sales they drove). For a radio ad, you might use a promo code such as RADIO10 for 10% off tickets – then count how many times that code is redeemed. Each redemption is directly tied to that station’s listeners. Influencer and partner promotions should be handled similarly: provide each influencer with their own link or code (e.g. DJMikeVIP for DJ Mike’s followers). This approach was a cornerstone of one festival’s influencer strategy – by assigning individualized codes, they could tell which influencer drove how many ticket sales. They discovered, for instance, that one micro-influencer’s posts yielded 80 ticket redemptions while a bigger celeb’s code was barely used, revealing who actually had pull with their target audience.
Post-event surveys are another powerful offline attribution tool. Include a question like “How did you hear about this event?” or “What influenced your decision to buy a ticket?” on your attendee survey. Attendees’ answers (e.g. 40% say “heard from a friend”, 25% “saw on Instagram”, 15% “email from you”) give you a rough gauge of which channels were most effective. While self-reported data isn’t 100% precise, it can capture word-of-mouth and other influences that digital tracking might miss. Importantly, these methods help translate traditionally “untrackable” marketing into solid numbers. When presenting ROI, you can then include, for example, “Flyer campaign: 200 tickets sold via QR code (ROI 3:1)” or “Campus street team: 150 redemptions using promo code ‘Campus’”. It takes extra effort to set up tracking for offline media, but in 2026 it’s expected – and it prevents your offline budget from turning into an ROI black hole.
First-Party Data and Integrated Analytics
With tightening privacy rules and third-party cookies on the way out, first-party data (the data you collect directly from your audience) is more valuable than ever for proving ROI. This includes your ticketing platform data, email lists, CRM information, and onsite engagement stats. Ideally, you want an integrated system where ticket purchase data flows into your marketing reports. Modern all-in-one event platforms like Ticket Fairy are designed to do exactly this – linking your marketing campaigns to ticket sales in one dashboard. For example, Ticket Fairy’s analytics can show “X tickets sold via Facebook Ads, Y via email, Z via referrals” without you having to manually reconcile multiple sources. This real-time insight means you can calculate accurate CAC and ROAS by channel on the fly. If you notice your Google Ads have a $10 CPA (cost per acquisition) while your print ad’s CPA is $50, you’ve got actionable evidence to shift spend (or negotiate a better print deal).
When evaluating the best event marketing tools and platforms for ROI, promoters should prioritize systems that natively unify ticket sales with campaign data. If you are wondering what platforms help prove event marketing ROI most effectively, look for all-in-one solutions that offer built-in affiliate tracking, automated pixel integration, and real-time ROAS dashboards. Using dedicated event marketing platforms to prove ROI eliminates the need for manual spreadsheet reconciliation, allowing your team to track returns on event marketing efforts instantly and accurately.
First-party data also enables multi-channel attribution within your own ecosystem. By tracking each buyer’s journey in your CRM, you might see that a person clicked your ad, then received your email, and finally bought after a retargeting ad. With all data in one place, you can assign partial credit to each and avoid double-counting the sale. Attribution in 2026 is as much an art as science, but owning your data gives you the flexibility to tailor models that make sense for your event. Another advantage: having concrete data builds trust not just internally but also with partners. When you can hand a sponsor a report showing “Your sponsored post generated 500 clicks and 50 ticket sales”, or show a venue owner that “Our campaign in your city had a CAC of $8, well below the $15 average”, it boosts your credibility. In summary, consolidating your marketing and sales data is foundational for proving ROI. Whether through an integrated ticketing platform or diligent data engineering, breaking down those data silos will give you clearer attribution, stronger insights, and more authoritative ROI proof to share.
Tracking Sponsor ROI Through Ticket Sales
For many promoters, demonstrating value to brand partners is just as critical as internal reporting. If you are evaluating the best ways to track sponsor ROI through ticket sales, the answer lies in dedicated attribution infrastructure. By assigning unique promo codes and UTM tracking links to each sponsor, organizers can directly measure the ROI on tickets generated by a partner’s promotional efforts. This sponsor ROI calculation transforms vague brand awareness into hard conversion data. When a beverage brand or media partner shares their custom link, your ticketing dashboard captures every resulting transaction. This allows you to present sponsors with concrete evidence of their impact, proving that their investment yielded a specific volume of ticket sales alongside traditional event sponsorship exposure.
Analyzing Channels and Campaign ROI
Calculating Cost per Channel
Once your tracking is in place, the next step is to analyze ROI on a channel-by-channel basis. This means calculating metrics like CAC, CPA (cost per acquisition), and ROAS for each marketing channel or campaign. Start by tabulating your spend and results per channel. For instance, how much did you spend on Facebook Ads, and how many ticket sales (or revenue) can you attribute to them? Do the same for Google search ads, email campaigns, influencer partnerships, PR stunts, etc. By dividing the spend by tickets sold, you get a cost per ticket for each channel. These figures can be eye-opening. You might find your Cost per Ticket is $15 via social ads but $50 via a billboards campaign – a clear sign one channel is more efficient. It’s not uncommon for traditional media or poorly targeted campaigns to have very high costs per ticket. For example, one promoter calculated that a small magazine ad cost them $50 per ticket acquired, whereas their Google search ads were about $10 per ticket – guess where they decided to funnel more money next time! (avoiding ineffective tactics). By quantifying these differences, you turn abstract performance into concrete numbers that anyone can understand. Below is a simplified illustration of how ROI can vary across channels in a hypothetical event campaign:
| Channel | Spend | Tickets Sold | Cost per Ticket (CAC) | ROAS (Revenue/Spend) |
|---|---|---|---|---|
| Facebook Ads | $2,000 | 150 | $13.33 | 3.75× |
| Google Ads | $1,500 | 120 | $12.50 | 4.0× |
| Email Marketing | $100 | 50 | $2.00 | 25× |
| Street Team Flyers | $500 | 10 | $50.00 | 1.0× |
Table 2: Example of per-channel spend vs. results (assuming an average $50 revenue per ticket). Digital channels often show far lower CAC and higher ROAS compared to broad offline tactics.
When evaluating these figures, context is everything. Many promoters ask about specific Facebook ads cost per signup benchmarks in 2026 to understand if their campaigns are on track. For a standard consumer music festival, a cost per acquisition (CPA) of $10 to $25 is typical. However, if you are driving high-ticket B2B event registration, a $200 CPA might actually represent a phenomenal return on investment. If that spend acquires a conference attendee who pays $1,500 for a VIP pass and has a high likelihood of returning next year, the ROAS remains incredibly strong. Always measure your channel costs against the specific price point and lifetime value of your target audience rather than relying on generic industry averages.
To further contextualize these figures, consider the lifetime value of the attendees you are acquiring. While a $200 CPA for a B2B conference registration might seem steep initially, if that attendee historically renews their pass for three consecutive years and brings a colleague, the true event marketing ROI of that Facebook ad campaign is exponentially higher. Promoters must train their teams to look beyond the initial conversion event and evaluate the long-tail revenue generated by each specific marketing channel.
Looking at such data, it’s clear which channels are pulling their weight. In this example, email marketing has an outstanding ROI (25x!), likely because the only cost was a small email service fee and it targeted past attendees who readily converted. Social and search ads delivered a solid 3.75x–4x ROAS – these are profitable and probably worth further investment. The street team flyers barely broke even with a 1.0x ROAS (spend $500 to get $500 back in ticket sales) – not necessarily a loss leader if they added some awareness, but hard to justify repeating without improvements. In your own analysis, make sure to factor in context: for instance, a channel with higher CAC might be reaching new audiences (higher acquisition cost is expected for brand-new customers), whereas a low CAC channel might be reactivating loyal fans (who are cheaper to convert). Also consider capacity – maybe there’s only so much inventory for radio spots or only so many emails you can send without fatigue. However, the overall principle stands: by breaking down cost and return by channel, you gain a playbook for where to focus your efforts and budget.
Comparing Campaign Effectiveness and Adjusting Budget
Analyzing ROI by channel naturally leads to the question, “Where should I reallocate budget to maximize returns?” The beauty of having ROI metrics is that you can answer this with evidence. As a rule, invest more in high-ROAS channels and optimize or cut the low-ROAS ones (as recommended by experts). If your analysis shows that one campaign is delivering tickets at half the cost of another, shifting funds is an easy call. For example, a music venue promoting a series of shows found that their Instagram ad campaigns were yielding a 5x ROAS, while a local newspaper ad barely hit 1x. Armed with this info, they reduced their print spend and doubled the social budget, resulting in a far better total outcome for the same budget. Over time, these decisions compound into significantly higher ticket revenues. One case study from an event organizer showed that by continuously trimming underperforming channels and scaling winners, they boosted overall marketing ROI from 200% to 350% over a year of events.
Another benefit of ROI analysis is optimizing within channels. You might compare multiple campaigns on the same platform. Perhaps one set of Facebook ad creatives aimed at 18–24 year-olds generated 300 tickets (great!), while a different creative for 25–34 year-olds cost twice as much per sale. In response, you’d pause or tweak the underperforming segment and funnel resources into the better-performing audience. This granular optimization is essentially A/B testing at the channel or targeting level (more on A/B testing soon). The result is campaigns that constantly improve. Many promoters hold weekly or bi-weekly check-ins on campaign metrics during the sales cycle. In these meetings, they review what channels or tactics are ahead or behind targets and adjust spend accordingly. For instance, if mid-way through the campaign they see Google Ads have already hit 8x ROI (fantastic) and still have search volume, they might up the budget cap there. If simultaneously they see a content marketing effort isn’t driving conversions, they might put that on pause and save the budget. This dynamic rebalancing can significantly boost the final outcome – it’s not unheard of to reclaim 10–20% of budget from low performers and reapply it to top performers, effectively generating extra ticket sales with the same overall spend (as seen in successful case studies). The lesson is clear: treat your marketing budget as fluid, guided by the real-time ROI data. By campaign’s end, you’ll have squeezed the maximum ticket sales out of your budget, which makes for very happy stakeholders.
Event Budgeting for Maximum ROI
Mastering event budgeting for maximum ROI requires a shift from static spreadsheets to dynamic financial planning. Rather than locking in your entire promotional spend months in advance, seasoned promoters hold back a percentage of their budget—often 15% to 20%—as a flexible reserve. This agile approach allows you to double down on high-performing channels as real-time data rolls in. If a specific TikTok ad creative suddenly goes viral and drives a low acquisition cost, you have the liquid capital ready to scale that campaign immediately. Conversely, if a traditional print buy isn’t moving the needle, you can cut your losses without derailing your overall financial strategy. Effective budget allocation isn’t just about minimizing costs; it’s about strategically deploying capital where the data proves it will generate the highest volume of profitable ticket sales.
Proving ROI for Different Event Types
It’s worth noting that ROI expectations can vary with different event types and goals. A massive festival with an 80,000 capacity might accept a higher upfront CAC because the absolute revenue per attendee (tickets plus camping, F&B, merch) is high – and they might invest more in broad branding campaigns. Meanwhile, a local 300-person conference might need to see immediate ticket returns from each marketing effort due to a limited audience size and tighter budget. Knowing your event’s context helps in setting ROI benchmarks. For example, an industry B2B conference could consider leads generated and deals influenced as part of ROI (not just ticket revenue). In such cases, you’d work with your sales team to attribute new business value to event marketing. Or a free festival with sponsors might measure ROI in terms of engagement and data collected (to show sponsors value), rather than revenue. Always align your ROI metrics with the ultimate business objective of your event – whether that’s direct ticket profit, sponsorship fulfillment, community growth, or something else. Then, use the same rigorous tracking and analysis to show how marketing spend contributed to those outcomes. By customizing ROI analysis to your event’s goals, you make the data far more meaningful to stakeholders. The common thread for all events: tie dollars spent to tangible results, and communicate it in terms that matter for that event’s success.
Beyond Ticket Sales: Engagement, Retention & ROI
Social Engagement vs. Ticket Conversions
Modern event marketing isn’t just about immediate ticket sales – it’s also about building buzz and engagement that can lead to sales. But how do you quantify the ROI of a viral hashtag or a big social media following? The key is to connect engagement metrics to conversions whenever possible. Likes, shares, and comments are valuable in that they indicate audience interest and can expand your reach (earned media), but they don’t pay the bills on their own. Many social campaigns generate attention that indirectly boosts ticket sales through increased awareness or FOMO. To prove their ROI, track how engagement translates into site traffic and purchases. For example, if a lineup announcement video racks up 100,000 views on TikTok, check your web analytics for a traffic spike or ticket surge that day. If you see that TikTok video brought 5,000 people to the ticket page and 300 bought, you can attribute those sales back to the content. On the other hand, don’t be fooled by big numbers with no action – one festival learned that a comedic TikTok that went viral (100k+ views) generated negligible ticket sales, whereas a targeted Facebook post with only ~1,000 views drove 50 tickets. In their ROI report, the smaller campaign had far higher ROI despite the lower engagement vanity metrics. The lesson is to focus on quality of engagement: an engaged 1,000 who actually convert is worth more than 100k passive viewers. When presenting to stakeholders, frame engagement in terms of business impact. Instead of “We got 10,000 Instagram likes,” say “Our Instagram campaign attracted 10,000 likes and drove 1,200 clicks to the ticketing site, resulting in 150 sales.” This ties the engagement to ROI directly. There are also ways to estimate the value of engagement via earned media value (EMV) – where you calculate what that exposure would have cost if you paid for it – but be cautious, as stakeholders prefer concrete sales data over hypothetical value. Use EMV or reach metrics as supporting evidence of brand growth, but always try to link back to actual ticket revenue or conversion rates so the ROI is clear.
Attendee Loyalty and Repeat Attendance
ROI isn’t only about the immediate campaign – it’s also about the long-term value being created. One often overlooked aspect is the ROI of attendee loyalty. Happy attendees who return year after year (or to multiple events you host) dramatically lower your future marketing costs and increase lifetime revenue. For example, if 30% of this year’s festival-goers also attended last year, you have a strong core of loyal customers to build on. The money you spent on marketing to re-engage them has a high ROI because loyal fans convert much faster (some will buy tickets as soon as they go on sale, with minimal prompting). You can measure loyalty in several ways: repeat ticket purchases, membership or fan club sign-ups, social media groups formed by fans, etc. Net Promoter Score (NPS) is a popular metric to gauge loyalty – by asking attendees “How likely are you to recommend this event to a friend?” and getting a score, you get a sense of how many promoters vs detractors you have. A high NPS correlates with future growth (and thus ROI) since word-of-mouth from promoters brings in new customers for free. In fact, 92% of consumers trust recommendations from friends and family over any form of advertising, so your loyal fan advocates are marketing gold.
To maximize and prove ROI from loyalty, track the retention rate of attendees. If you notice your second-year event saw 50% of first-year attendees come back (and maybe bring new people along), that repeat business saved you a ton in acquisition cost – essentially doubling ROI for that segment when viewed over two events. You can also calculate metrics like Customer Lifetime Value, as discussed earlier, to show how much revenue a retained attendee generates versus a new one. Presenting something like “We spent $5,000 on a loyalty email campaign (discount codes for returning attendees) which brought back 300 attendees who spent $30,000 total – an incredible 6x ROI just on retention” will grab your stakeholders’ attention. They’ll see that marketing isn’t just filling the funnel with one-off attendees; it’s cultivating a community that yields increasing returns over time. Post-event engagement plays a role here too – following up with attendees via thank-you emails, highlight reels, and loyalty rewards can boost satisfaction and likelihood to return. Those efforts may not have immediate sales attached, but they set the stage for lower CAC and higher ROI in the next cycle. As a best practice, include in your ROI reports a section on attendee retention and referrals. It reminds decision-makers that marketing isn’t just about the short-term gain, but also building an asset – a loyal audience – that drives long-term profitability.
To capture this data accurately, promoters must implement fast post-event attendee surveys and NPS tracking immediately after the festival or conference concludes. Striking while the experience is fresh—ideally within 24 to 48 hours—yields the highest response rates and the most reliable feedback. By integrating these feedback mechanisms directly into your CRM or ticketing platform, you can segment Net Promoter Scores by ticket tier. For example, discovering that VIP buyers have a significantly higher NPS than general admission attendees provides concrete justification for expanding premium inventory next year. Ultimately, systematic feedback collection transforms subjective attendee sentiment into a hard, trackable metric that proves the long-term ROI of your on-site experience investments.
Word-of-Mouth and Referral Power
One of the most potent (and cost-effective) marketing forces for events is word-of-mouth. Happy attendees often become ambassadors, telling friends, posting on social media, and generally creating buzz for free. While you can’t directly buy genuine word-of-mouth, you can nurture and measure it to some extent – and it absolutely factors into ROI. Consider an example: your post-event survey finds that 40% of attendees heard about the event from a friend or family member. That’s almost half your audience acquired at essentially no marketing cost! It suggests that the money you invested in delivering a great attendee experience has an indirect ROI by turning attendees into promotors. You can capitalize on this through referral programs. Many events set up referral links or codes where attendees get a perk (like a discount or upgrade) for referring new ticket buyers. With a platform like Ticket Fairy or using your own tracking, you can see exactly how many extra tickets were sold via referrals and attribute those to the “Referral” channel. Often, referral-driven sales have a nearly zero CAC, since your only cost might be a small reward or just the effort of setting up the program. For instance, a New Year’s Eve event might discover that 100 attendees brought 150 additional guests through referral links – effectively doubling sales with minimal spend. In ROI terms, if you gave a 10% discount as the referral reward on those 150 tickets, and otherwise spent nothing, the ROI is enormous (the revenue minus the small discount vs. near-zero cost).
Even without formal referral schemes, track social chatter. Monitor your event hashtags, track shares of your posts, and look for user-generated content (UGC) like “I got my ticket!” screenshots or fan videos. These indicate organic advocacy. Some marketers calculate an earned reach – e.g. “Fans’ personal posts about the event reached 50,000 people – which at our typical $0.10 per impression ad cost would equate to $5,000 in value.” Again, that’s a softer metric, but it contextualizes the word-of-mouth in terms stakeholders understand (media value and potential sales). You might highlight in a report that “Fan-driven promotion generated an estimated $X in media value and directly resulted in Y tracked ticket sales.” Crucially, emphasize how you’ve facilitated this: perhaps by creating shareable content (filters, photo ops, branded hashtags) or by leveraging super-fans via ambassador programs. If you ran a contest for people to tag friends and it led to 500 new sign-ups or a big bump in web traffic, call that out as a smart ROI-positive strategy (a contest costs you maybe a few free tickets as prizes, but yields many new potential customers). In summary, word-of-mouth is the multiplier of your marketing ROI – it’s what can turn a modest campaign into a sell-out success. By finding ways to measure and present the impact of referrals and fan advocacy, you complete the ROI picture beyond what paid marketing alone could achieve.
Optimizing ROI: Testing and Continuous Improvement
Test and Learn with A/B Experiments
Every event marketing campaign has room to improve, and one of the best ways to systematically boost ROI is through A/B testing. By experimenting with different variations of your marketing tactics, you can discover what resonates best with your audience and drives more conversions per dollar. Virtually anything can be A/B tested: ad creatives (image A vs image B), ad copy, email subject lines, call-to-action buttons on your ticket page, even the timing of your posts. For example, you might send two versions of an email – one with the subject “Don’t Miss Out on XYZ Festival – Tickets Selling Fast!” and another with “XYZ Festival Tickets – Special Discount for You”. By splitting your audience, you find out which subject line yields a higher open and click-through rate. If the “Don’t Miss Out” subject gets a 28% open rate vs 18% for the other, you’ve just found an approach that could potentially deliver ~50% more engagement, meaning more ticket buyers opening their wallets. The same applies to ads: perhaps an ad creative featuring the headlining artist performs 30% better (in terms of click-through and conversion) than one featuring the venue photo. That insight lets you allocate budget to the top-performing creative, effectively improving your ROAS without spending more – you’re just getting more results for the same spend by using the best tactics (as demonstrated by high-ROAS campaigns).
To implement A/B testing, define one variable to test at a time and keep a control vs. experimental setup. Many platforms have built-in tools (e.g. Facebook’s split test feature, email marketing A/B testing tools, etc.) or you can do it manually by segmenting audiences. Start early in your campaign so that you have time to gather results and scale up the winning variant. For instance, test two different early-bird offers on a small 10% of your list each; whichever deal yields more purchases, roll that out to the remaining 90%. When done correctly, A/B testing can lead to data-driven wins that directly boost ticket sales and ROI. In one case, an event organizer discovered through testing that marketing emails sent at 7 PM (when people are off work) had twice the conversion rate of those sent at 10 AM; shifting their schedule led to noticeably higher weekly sales. Another test might reveal that a “Buy Tickets” call-to-action on your landing page converts better than “Register Now”. These may sound like small tweaks, but they add up. Consistent testing and iterating can easily improve your conversion rates by a few percentage points here and there – which can translate to hundreds of additional tickets without raising the budget. When presenting ROI results, include these testing insights: it demonstrates expertise and proactivity (“we optimized our campaign via 6 A/B tests, resulting in a 15% lower cost per conversion”), which further justifies your marketing spend as being put to very efficient use.
Optimizing Landing Pages and Checkout Conversion
A crucial (and often under-appreciated) factor in marketing ROI is the conversion rate of your ticketing pages and checkout process. You’ve spent money and effort to drive potential attendees to your event page – now the goal is to have as many of them as possible click “Buy”. Improving the percentage of visitors who complete a purchase means more tickets sold for the same marketing spend (i.e. higher ROI). This discipline is known as Conversion Rate Optimization (CRO). Start by looking at your funnel metrics: out of all the people who land on your ticket page, how many add tickets to cart? And how many of those complete the checkout? Say 10,000 people visit the page and 500 buy tickets – that’s a 5% conversion rate overall. If you can raise that to 6% through optimizations, you’d sell 600 tickets instead – 100 extra sales at no extra marketing cost!
Focus on improving the clarity and persuasion of your event page. Ensure the most compelling info (artist lineup, headliner names, date/time/location, unique selling points) and a strong CTA are immediately visible. Speed and mobile optimization are also vital – a slow-loading or non-mobile-friendly page will leak potential buyers. Over half of ticket buyers now purchase on mobile devices, so test your pages on phones: is the “Buy Tickets” button obvious without scrolling? Is the text easy to read? One study shows ticket purchase abandonment rates can be as high as 60–80% when the checkout is clunky. That’s a lot of lost revenue due to friction. Simplifying the checkout (fewer form fields, guest checkout option, trusted payment logos) can drastically reduce drop-offs. For example, when a festival switched to a one-page checkout and added digital wallet payment options, their cart abandonment dropped and immediate sales jumped ~10%. For ROI, that’s like getting 10% more outcome from the same input – a massive efficiency gain.
Consider using analytics tools or user testing to identify bottlenecks. A heatmap might show that few people scroll to the bottom where the “buy” button sits – clueing you in to move it higher. Or analytics may reveal that many users start checkout but bail at the payment step, suggesting issues (like limited payment methods or hidden fees causing “sticker shock”). By solving those issues, you recapture those potential buyers. Put simply, marketing doesn’t end when someone clicks your ad; it ends when the ticket is in their cart and paid for. By optimizing that last mile of the journey, you maximize the ROI of every marketing channel feeding into it. When you report on marketing success, being able to say “We also improved our website conversion rate from 4% to 5%, netting an extra $X in ticket sales without extra ad spend” is a powerful proof point of marketing prowess and wise use of resources.
Monitoring Campaigns and Pivoting in Real Time
In the fast-paced world of event sales, timing is everything – and 2026’s trend of last-minute ticket buyers means marketers must stay nimble. To maximize ROI, it’s critical to monitor live campaign performance and be ready to pivot on the fly. We touched on this in the channel analysis section, but it’s worth emphasizing as a strategy of its own. Set up a routine to check your key metrics (spend, clicks, conversions, CPA, ROAS) daily or at least weekly during the campaign. If a particular ad isn’t hitting targets after a reasonable test period, don’t hesitate to tweak the creative or targeting, or turn it off and reallocate the budget. Conversely, if you have a waiting list or see organic momentum (e.g. a big spike in direct traffic after an artist announcement), consider dialing back paid spend to avoid unnecessary costs – your ROI will thank you. Agility can significantly improve ROI by reducing spending on things that aren’t working and capitalizing quickly on what is.
A real-world example: a concert promoter noticed midway that their YouTube video ads had a much higher view rate than expected but weren’t converting into ticket sales. They quickly added a stronger call-to-action overlay on the video and adjusted the targeting to a narrower radius around the venue – within days, the conversion rate on those ads improved, salvaging the campaign’s ROI. In another instance, an event saw slower early sales than forecast, so the team reallocated some budget to a flash 48-hour promo (a “lightning sale” with a small discount) on social media. The urgency boosted conversion and put the campaign back on track to hit targets. These kinds of on-the-fly optimizations can be the difference between falling short versus selling out (calculating event marketing ROI). Make sure to log these actions and their outcomes, as they themselves become ROI proof points: “When we saw Channel X underperforming, we swiftly shifted $1,000 to Channel Y which led to 200 additional sales – avoiding what could have been wasted spend.” Not only does this improve your results, but it also demonstrates to stakeholders that your team is actively managing the budget responsibly and effectively (while budgets surge). In the post-mortem, you can highlight how real-time decisions improved the bottom line, reinforcing confidence in your strategy and in any future budget requests.
True event ROI optimization is a continuous lifecycle process rather than a post-event post-mortem. It requires integrating your ticketing platform’s real-time sales data with your ad network dashboards so that performance anomalies trigger immediate action. For instance, if a specific geographic target suddenly shows a spike in conversion rates, an optimized system automatically routes more budget to that region. By treating return on investment as a dynamic metric that fluctuates daily, promoters can squeeze maximum yield from their promotional capital before the event doors even open.
Leveraging High-ROI Channels and Tactics
Finally, a smart way to improve overall event marketing ROI is to lean into inherently high-ROI tactics. We’ve identified some through our metrics: email marketing, for example, consistently stands out as a channel with extremely high ROI (often £36 or more for every £1 spent) (especially for small events) (according to HubSpot data). Ensuring you have a strong email strategy – segmented lists, personalized content, automated reminders – is low-hanging fruit for ROI. If your event marketing team hasn’t invested much in email or CRM, consider this a priority (especially since building your email list is an asset that pays off across events). Personalized, targeted emails to past attendees or interested sign-ups can drive conversions at minimal cost, as data frequently shows. Similarly, referral programs and ambassador schemes have huge ROI potential. These turn your fans into your marketers. The cost might just be a free T-shirt or a free ticket for every 5 referrals – a tiny expense in exchange for new sales – and the tracking, as discussed, is straightforward. Some events have reported that referral programs helped them sell 20–30% of their tickets with virtually no ad spend, dramatically lifting overall ROI (turning fans into promoters) (as seen in partnership strategies).
Other high-ROI moves include content marketing and SEO for evergreen discovery. An in-depth blog post about your festival’s lineup or a guide to the event’s city can rank on Google and funnel interested readers to your ticket page for months, with just the one-time content creation cost. Community engagement tactics like running contests or encouraging user-generated content also often yield great returns for minimal spend (reaching high-intent buyers). For example, a giveaway of two VIP passes in exchange for social shares might “cost” you those tickets (which could be spare inventory anyway) but end up reaching tens of thousands of people and generating hundreds of email sign-ups or ticket purchases. That’s effectively a near-zero CAC for each new customer acquired via the contest. The overarching idea is to identify where you get unusually high returns, and maximize those. In your ROI reporting, don’t shy away from highlighting these superstar tactics. It reinforces an important narrative: that you’re not just spending money, you’re also saving money by exploiting cost-effective channels. A line like “Our social media contest generated 5,000 leads at a cost per lead of under $0.50, some of whom converted into ~200 ticket sales – far cheaper than any paid ad” is music to a stakeholder’s ears. It shows you are stretching the budget and being creative in the pursuit of results. By continuously allocating effort to high-ROI activities (and automating them where possible, e.g. marketing automation for emails), you elevate the overall ROI of your marketing mix, making it easier to justify every pound and ask for more when the time comes to scale up your next event.
Presenting ROI to Stakeholders
Translating Metrics into Business Outcomes
All the metrics in the world won’t help if they aren’t communicated in a way that stakeholders understand. When proving event marketing ROI to others – be it your boss, the finance team, a client, or sponsors – frame your results in terms of business outcomes and objectives. Start by aligning with what they care about. Does your exec team primarily care about profit? Then emphasize how your marketing delivered revenue well above its cost, contributing to net profit (e.g., “Our £50k marketing spend generated £200k in ticket revenue – a net gain of £150k and an ROI of 300%”). If they care about growth, highlight increases in attendance and new customer acquisition (e.g., “Attendance grew 20% while keeping CAC flat, indicating efficient growth”). For sponsorship or brand-focused events, you might lean on engagement and reach stats but tie them to value (e.g., “Our event hashtag trended locally, achieving 2 million impressions – equivalent to £X in advertising – boosting brand visibility for our sponsor which reported high satisfaction”). Always circle back to how marketing contributed to the bottom line or strategic goals. One effective method is to use before-and-after comparisons: “Last year, we spent the same amount but only sold 5,000 tickets. This year, with a data-driven approach, we sold 6,000 tickets for the same spend – a 20% improvement in marketing efficiency.” That clearly shows progress and ROI improvement over time.
Make liberal use of clear visuals and tables in stakeholder reports. A simple chart showing marketing spend vs. ticket revenue over several years, or a pie chart of ticket sales by source, can immediately communicate ROI. For example, a pie chart might reveal that 50% of sales came from digital ads, 30% from email+referrals, 15% from partnerships, and 5% from other sources. If you annotate that with the ROAS of each, stakeholders see not just where sales came from but how profitable each channel was. Stakeholders also love benchmarks and industry comparisons. If you can say, “Our marketing ROI is 5:1, well above the industry average of ~3:1 for events”, it adds credibility (just be sure your benchmark source is solid). Use external stats strategically to reinforce your narrative – for instance, citing that only 30% of marketers feel they can measure social media ROI, and then showcasing how you’ve managed to do it, positions your team as ahead of the curve.
Furthermore, stakeholders frequently want to compare event marketing ROI across different organizers to gauge relative performance. To do this accurately, ensure you are comparing apples to apples—aligning your metrics with similar event categories, capacities, and geographic markets. Utilizing anonymized industry benchmark reports or networking with non-competing promoters can provide baseline data. When you can demonstrate that your 4x ROAS outpaces the 2.5x average of similar mid-sized festivals in your region, you transform raw data into a compelling competitive advantage.
If you want to accurately compare event marketing ROI across different organizers, look beyond basic ticket volume. Evaluate the ratio of marketing spend to gross revenue within specific genres or venue sizes. For instance, an electronic music festival might naturally have a lower customer acquisition cost than a niche B2B tech summit. By contextualizing your metrics against peer benchmarks—often available through ticketing platform insights or industry associations—you can confidently demonstrate to investors that your promotional efficiency leads the market.
When you are actively proving event ROI, remember that transparency builds long-term trust. If a specific channel underperformed, highlight the swift actions your team took to pause the spend and reallocate those funds to higher-converting campaigns. This level of operational agility reassures financial backers that their budgets are being actively managed. Ultimately, mastering ROI event marketing isn’t just about validating past expenditures; it is about securing the capital needed to scale your future festival, club night, or conference.
Focusing on Clarity and Attribution in Reports
When delivering ROI reports, remember that not all stakeholders are marketing experts – avoid jargon overload. Define metrics briefly if needed or include a glossary in an appendix. Instead of drowning them in data, focus on a few key KPIs and insights that matter. A good structure is: Objectives ? Strategy/Spend ? Results ? Interpretation. For example: “Objective: Sell 10,000 tickets and increase out-of-town attendance by 15%. Strategy & Spend: Invested in targeted social ads, influencer partnerships, and email to past attendees (budget £40k). Results: Sold 10,500 tickets (105% of goal); out-of-town attendees up 20%. Achieved overall marketing ROAS of 4.5x. Interpretation: Exceeded sales goal while efficiently expanding reach. Facebook/Instagram ads had the highest ROI at 6x, validating our focus on those channels. Radio ads underperformed at 1.2x ROAS, which we’ll re-evaluate next time.” This narrative-style reporting ties the numbers to goals and learnings. It answers the stakeholder’s implicit question: “So what did we get for the money?” clearly and succinctly.
Adopting event marketing ROI reporting best practices for executives means elevating the conversation from tactical metrics to strategic business impact. C-suite leaders and investors rarely need to see daily cost-per-click fluctuations; instead, they want high-level summaries of customer acquisition costs, lifetime value trends, and overall profitability. Tailoring your reports to highlight these macro-level financial outcomes ensures that your marketing strategies are viewed as vital revenue drivers rather than expendable line items.
A common question from teams upgrading their reporting is: how do event marketers visualize ROI data effectively? The most persuasive reports move beyond static spreadsheets by utilizing dynamic dashboards and visual storytelling. Consider using funnel charts to illustrate the attendee journey from initial ad impression to final checkout, highlighting conversion drop-offs. Heatmaps can show which geographic regions or demographic segments are yielding the highest returns, while stacked bar charts are excellent for displaying revenue attribution by channel over time. By presenting complex data visually, you make the narrative instantly digestible, proving ROI to event stakeholders without requiring them to parse dense numerical tables.
To implement these visual strategies, top-tier promoters integrate their ticketing platforms with business intelligence tools like Looker Studio or Tableau. By piping real-time sales data into these systems, you can build automated, self-updating dashboards. This setup not only saves hours of manual reporting but also ensures that when you are proving ROI to event stakeholders, the data is presented through clean, interactive charts that highlight the exact correlation between ad spend and ticket revenue.
Include attribution insights to bolster confidence. For instance, break down a sample customer journey: “One attendee’s path: saw our TikTok video (didn’t buy), later clicked a Google ad -> visited website -> signed up for newsletter -> received email -> purchased via email link. We tracked this journey end-to-end, demonstrating how our multi-channel strategy works together to drive conversions.” By sharing such examples, you illustrate the sophistication of your marketing and the thoroughness of your tracking. Stakeholders often appreciate knowing that you’re not double-counting sales. If you say “total attributed sales equal 100% of actual sales” or show a reconciliation between tickets sold and what your tracking accounted for, it builds trust in your figures. Also, consider highlighting cost savings or avoided losses. For example, “We identified and halted two under-performing campaigns mid-way, saving £5,000 that was reallocated to more effective channels – this likely prevented 500 tickets from going unsold.” This shows prudence and adaptability, qualities stakeholders value.
Justifying Budgets and Future Investments
The ultimate test of proving ROI is when it comes time to ask for the next budget. If you’ve done the groundwork, your ROI story will pave the way. Use your results to make a case for how additional budget could yield even greater returns. For example, “With an extra £10k next year, allocated to the channels we’ve proven most efficient (like social ads at 6x ROI and email at 10x), we project we can sell 1,000 more tickets, increasing revenue by £50k+. That’s a clear net gain.” Concrete projections rooted in your data demonstrate that you’re not just asking for more money – you have a plan to multiply it. Also address scalability: if certain channels are tapped out (e.g., you saturated your email list), explain how new budget would fund growth initiatives like list building or new market outreach, and tie those to ROI via expected CAC. Perhaps mention testing new promising channels with small pilot budgets first (stakeholders appreciate risk-managed approaches). For instance, “Last campaign, we tested TikTok ads on a small scale and saw a promising CAC of $8. With more investment, we anticipate reaching a younger demo at similar efficiency, contributing an additional 15% sales.”
Don’t forget qualitative proof to accompany the numbers. Include a few stakeholder quotes or sponsor feedback if available (e.g., “Sponsor X reported a great uptick in their booth traffic and is eager to return, citing our promotional campaign ROI as a key factor”). Or an attendee quote from a survey about how they found the event from a friend who saw your social media – illustrating the ripple effect of your marketing. This humanizes the data. Finally, be transparent about learning and improvements. If some tactics didn’t work, acknowledge them and explain what you’ll do differently. Stakeholders know not every bet hits; what they want to see is that you measured, learned, and will optimize further. Position any misses as valuable lessons that will improve future ROI. By presenting a balanced, data-rich, yet clear story of your marketing ROI, you not only justify what was spent – you set the stage for continued or increased investment by showing that marketing dollars in your hands turn into even more dollars out.
Frequently Asked Questions About Event Marketing ROI
What is the ROI of combining events with digital marketing?
The ROI of combining in-person events with digital marketing is highly synergistic. Digital campaigns not only drive initial ticket sales but also amplify the event’s reach through live streams, social media engagement, and post-event content. This hybrid approach extends the lifecycle of your event, creating additional monetization opportunities like digital sponsorships and on-demand content access, which significantly boosts overall profitability.
How do you measure ROI in event marketing strategies effectively?
To measure ROI in event marketing strategies, organizers must track the total revenue generated from ticket sales, sponsorships, and on-site purchases against the total cost of their marketing campaigns. Utilizing multi-touch attribution models, UTM parameters, and integrated ticketing platforms allows promoters to pinpoint exactly which channels—such as email, social ads, or influencer partnerships—are delivering the highest return on ad spend (ROAS).
????? ? ROI (What is ROI) in the context of event promotion?
In event promotion, ROI (Return on Investment) is the ultimate measure of a campaign’s financial success. It calculates the net profit generated from marketing activities relative to the cost of those activities. A positive ROI indicates that your promotional strategies are effectively converting ad spend into profitable ticket sales and long-term attendee loyalty.
What is the best framework for proving ROI to event stakeholders?
Proving event ROI to stakeholders requires shifting the conversation from vanity metrics to concrete business outcomes. Start by aligning your reporting with their specific goals—whether that is direct ticket revenue for festival investors, lead generation for B2B conference organizers, or food and beverage upsells for venue operators. Use visual dashboards to demonstrate how your event marketing ROI directly correlates with customer acquisition costs and lifetime value, ensuring sponsors and financial backers see the clear monetary return on their investment.
What are the most critical event finance metrics to track in 2026?
In 2026, the most critical event finance metrics include Customer Acquisition Cost (CAC), Return on Ad Spend (ROAS), Customer Lifetime Value (CLV), and overall Marketing ROI. Tracking these financial indicators allows promoters and venue operators to accurately measure campaign profitability, optimize their marketing budgets, and present clear, data-backed revenue reports to stakeholders.
How should organizers approach event budgeting for maximum ROI?
Approaching event budgeting for maximum ROI involves treating your marketing spend as a fluid, data-driven investment rather than a fixed expense. Organizers should allocate a baseline budget to proven channels while holding a reserve fund (typically 15-20%) to scale high-performing campaigns in real time. By continuously monitoring metrics like ROAS and CAC, promoters can shift funds away from underperforming tactics and funnel capital directly into the strategies driving the most profitable ticket sales.
What does event ROI optimization entail for large-scale festivals?
For large-scale festivals, event ROI optimization involves continuously refining marketing spend across multiple channels to maximize ticket revenue and attendee lifetime value. This process includes A/B testing ad creatives, reallocating budgets to high-performing platforms in real time, and improving ticketing page conversion rates. The goal is to systematically lower customer acquisition costs while increasing the overall profitability of the event.
What is the best way to track sponsor ROI through ticket sales?
The most effective method for tracking event sponsorship returns is to issue unique promo codes and UTM tracking links to each partner. This allows organizers to monitor the exact ROI on tickets sold through a sponsor’s specific marketing channels. By integrating these tracking tools with your primary ticketing platform, you can provide sponsors with a clear calculation of the direct ticket revenue their promotional efforts generated.
How do event marketers visualize ROI data effectively?
Event marketers visualize ROI data effectively by moving away from static spreadsheets and utilizing dynamic, real-time dashboards. Best practices include using funnel charts to map the attendee purchasing journey, heatmaps to identify top-converting geographic regions, and stacked bar graphs to display revenue attribution by marketing channel. Integrating your ticketing platform with business intelligence tools ensures these visualizations remain accurate and up-to-date for stakeholder presentations.
How can promoters compare event marketing ROI across different organizers?
To compare event marketing ROI across different organizers, promoters should utilize anonymized industry benchmark reports and ticketing platform insights. It is crucial to align comparisons by event category, capacity, and target demographic. By evaluating the ratio of ad spend to gross ticket revenue against peer averages, organizers can accurately gauge their competitive performance and marketing efficiency.
How do post-event attendee surveys and NPS tracking improve marketing ROI?
Implementing fast post-event attendee surveys and NPS tracking allows organizers to quantify attendee satisfaction and predict future retention rates. By identifying “promoters” (highly satisfied attendees likely to return and refer friends), marketers can build highly targeted, low-cost referral campaigns. Additionally, tracking Net Promoter Scores over time provides stakeholders with hard data proving that investments in the on-site experience directly translate into higher lifetime value and reduced future acquisition costs.